Digital publishers want to get the maximum benefit from their revenue streams, but as many will likely agree, it’s hard to know if you’ve chosen the right earnings models or if something you’re doing is affecting that revenue negatively.
Mixing and matching these revenue models is not uncommon, but as we’ve discussed before on this blog, everything on a website page has the ability to dilute each other.
Below, we have two examples of publishers who experimented with their revenue models to find their site’s earnings sweet spot. Both websites were able to configure their programmatic advertisements with affiliate revenue and other revenue models in a way that earned them the maximum benefit from both, raising their overall EPMV.
eCPM or RPM does not account for multiple pageviews, and is simply the cost to advertisers for ads. These metrics can also not differentiate between high-earning or low-earning visitor types.
EPMV (earnings per thousand visitors) on the other hand, is revenue made by publishers per 1,000 visits. This accounts for revenue from multiple pageviews, and can be used to measure all revenue sources, not just advertising impressions.
Combining programmatic advertising with affiliate revenue
Originally, this independently owned review site with contracted works had no ads on their site and largely made money through affiliate revenue and product deals. When they started rolling in programmatic ads, they did so on a limited number of pages and were able to leverage these ads without impacting revenue. Once ads were added, they saw a 130% increase in EPMV from display ads over a two month period.

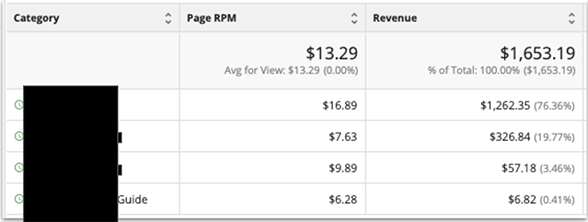
However, they were concerned about their affiliate revenue being impacted. Looking closer at their website, a piece of data they looked deeper into was their different categories. They noticed that their number one earning affiliate category was also their lowest earning ad by page RPM category. The site was earning about half as much money from ads on these pages and the affiliate revenue had gone down. Seeing this, they wanted to know if the programmatic ads were affecting their affiliate revenue.
Everything that engages your audience is going to compete with each other and dilute the value of something else on the page. They decided to experiment by removing ads from pages within those respective categories.

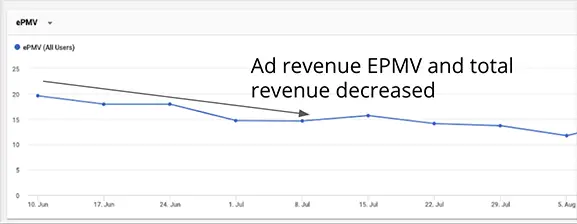
What happened was ad revenue and EPMV declined, but affiliate revenue increased by about 30% per visitor.

After this, they considered if it was possible to add ads back in, but do it in a way that would not affect their affiliate revenue too much. To do this, they added ads back into those pages with greater restrictions by using Ezoic to discern placements, capping total ads per page, and limiting where those ads could show.
In the beginning, affiliate EPMV was $25.12 and ad EPMV was $21.21. This came out to an average EPMV of $23.16
Once they removed ads, affiliate EPMV jumped up to $29.29, but ad EPMV dropped to $13.13, resulting in an overall average EPMV of $21.25
After experimenting with affiliate and ad balance, affiliate EPMV only dropped to $29.07, but ad EPMV jumped up to $19.18, leaving the site with an average EPMV of $24.12.

This was a 5% increase in EPMV for the site, resulting in a $550 per month improvement in revenue on those pages.
Due to these improvements, the site continues to experiment to find the sweet spot for their different website pages.
Testing different revenue models per visitor
The second site we’ll look at is a gaming news and info site that is owned by a publisher with multiple sites and is managed by a small team. The team’s focus was to build better brand loyalty. Their existing site EPMV from advertising was $12.56, but they were concerned with visitors ad-blocking, as gamers tend to install ad blockers.
To experiment with this, they created an ad-free experience through offering registrations.

After about three months, revenue declined by about 42% to $7.91 and the team became very concerned with revenue.

The new user EPMV at this point was $6.99 while the return user EPMV was $13.81. The website owner obviously did not understand the contribution that return users were having to their website revenue.
When looking into the data more, they found that:
- In this time span, there were 15,000 registrations
- The average estimated monthly revenue loss was $1,674, and growing
- In order to account for the accelerating loss, they would need each registrant to contribute $1.33
- Based on these figures, the site essentially was giving away $20,088 annually in exchange for email addresses and a promise to exclude users from only existing monetization strategy
Due to these major revenue drops, the site began to explore different revenue models:
- Subscriptions: to make up for overhead and churn, registrations would likely need to actually be $2-3.
- Donations: 1 in 10 registrations would need to donate $13.13 per year, or 1 in 100 to donate $133.00 per year
- Products/affiliates: get 2% of registered visitors to each generate $5.58 in sales profit per month
Since they already knew the value of ads, it would be easy to test these different models for different segments of visitors.

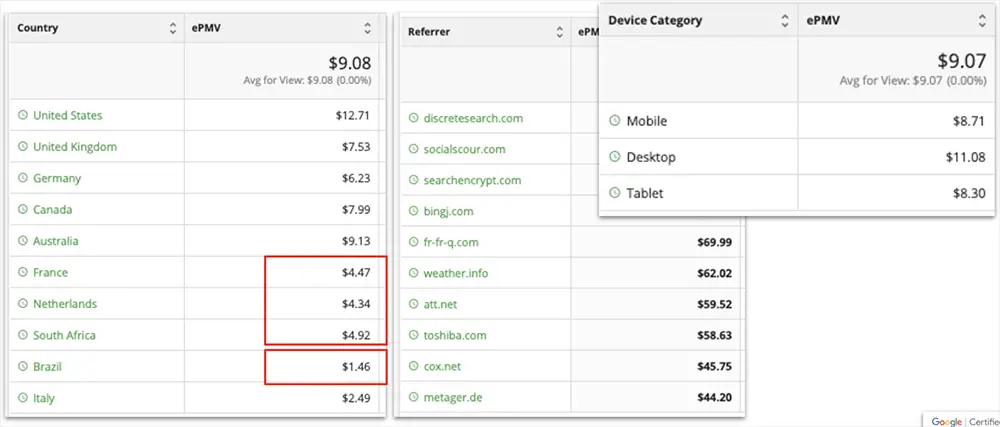
For example, visitors in France may have an average EPMV may be $4.47. If the average EPMV on the site is $9 and the average EPMV through subscriptions is $5, it makes sense to double down on the subscription model or the donation model. Once you understand how different users bring different values, you can segment by nearly anything: device type, referrer, country, etc.
In Summary
In the first instance, there is a publisher that increased monthly revenue by 20% and continues to improve EPMV month over month by maximizing both affiliate and ad revenue.
In the second instance, they understood the efficacy of other revenue models. They stopped the revenue decline and are now selling products in addition to ads, have increased revenue since the decline by 25%, and nearly recovered site wide EPMV for both registered and unregistered users.
Ad rates and values decrease or increase based on visitor behavior and visitor behavior is directly impacted by anything on the page that engages their attention.
The only way to understand what works for your website is to test it. You can test and know what models work, if you should show more or less ads, and what content you should create.
All of this testing needs to be done based on data. What’s great about testing different models is you don’t have to choose any one model; you can try multiple at one time. Since we are beholden to several large parties in the digital publishing space, the more tools we have in our tool belt, the better. Being able to own direct relationships and have more revenue streams helps give you more power and diversify risk.
There’s not always a clear place to start, as it is different for every site. To begin, figure out what you’re passionate about and begin testing that.

