Google recently announced that upcoming changes to Search Console by incorporating Core Web Vitals as new metrics that broaden how Google measures speed and website performance. With the announcement, Google provided information on a 6-month timeline in which these metrics would be monitored before they would ever be used as a part of search rankings. Anytime Google makes changes like this, publishers likely wonder, “How can I optimize core web vitals?”
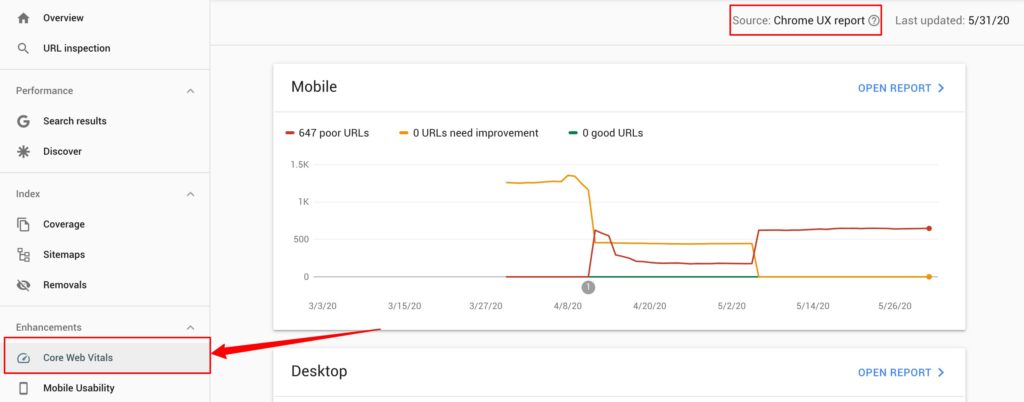
These new metrics can be found in Google Search Console. What was previously the “Speed Report” is now the Core Web Vitals tab. The data is pulled from the Chrome UX report (also known as CrUX).
Below, we are going to show you how to optimize Core Web Vital metrics.
What are Core Web Vital metrics?
The Core Web Vitals are a set of metrics related to speed, responsiveness, and visual stability, to help site owners measure user experience on the web. They were introduced by the Chrome Team at Google.
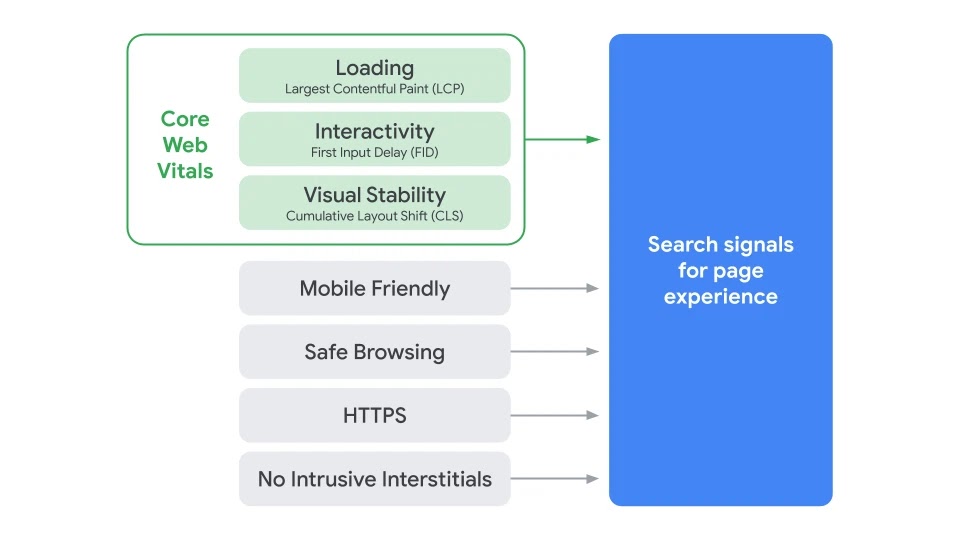
The three factors that make up the Core Web Vitals are Loading, Interactivity, and Visual Stability. But which metrics comprise these factors?
Loading: Largest Contentful Paint (LCP)
Interactivity: First Input Delay (FID)
Visual Stability: Cumulative Layout Shift (CLS)
Some of these performance metrics are common to publishers, like First Input Delay (FID). We cover this metric in our article on the average page speed statistics for 2020.
However, metrics like Largest Contentful Paint (LCP) and Cumulative Layout Shift (CLS) were essentially coined and created by Google. Knowing what these metrics actually mean is important to optimizing and understanding when these metrics matter and when they don’t.
Important: The Core Web Vitals are a new method for measuring a website performance, and is far more nuanced than just “fast or slow”, and includes measurements largely coined by Google that may not actually be reflective of a users actual experience.
What is CLS (Cumulative Layout Shift)?
CLS (Cumulative Layout Shift is a website loading metric for measuring visual stability. It aims to quantify how often users experience unexpected layout shifts.
Below is an example of a page that likely has a high CLS. The user places there cursor over the “No, go back” selection, and just before they click, the layout shifts, and “Yes, place my order” is accidentally chosen. This makes for poor user experience.
Unexpected movement of page content usually happens because resources are loaded asynchronously or DOM elements get dynamically added to the page above existing content. —Web.Dev
Asynchronous loading also happens with images. You can see a blank white space of the image below, which means the content will not jump around when the image loads fully. This site likely has a low CLS, as it keeps the content from jumping.

Things that might cause a high CLS:
- Image or video with unknown sizes
- Fonts rendering
- Third-party ads that dynamically resize
One of the big issues is that a website might look and behave differently for users than for developers. Images and other elements are often already in the developer’s browser cache, and API calls that run locally are often so fast that the delay or shifts aren’t noticeable.

So, in the eyes of Google, a low CLS helps ensure that the page functions properly for users. Their Good range is less than .1s.
What is FID First Input Delay?
First input delay (FID) measures the time between when a user first interacts with your site (i.e., when they click on something) to the time the browser is able to respond to the interaction.

To be classified in the “good” range, publishers should strive to have an FID of less than 100 milliseconds. FID is considered here for UX (user experience) because it can reflect how quickly the content a publisher cares about is immediately accessible upon request.
If you’re a WordPress site, FID increases are probably coming from your plugins. If you’re used to adding stuff in the “head” of your website, and if the items in the head make a lot of external Javascript calls, you might be slowing down FID significantly.
For WordPress users, this word of advice also holds true even for speed optimization plugins. Some publishers use not only one but multiple optimization plugins at the same exact time. These plugins often make external calls that may have the opposite effect and increase FID and slow your website down.
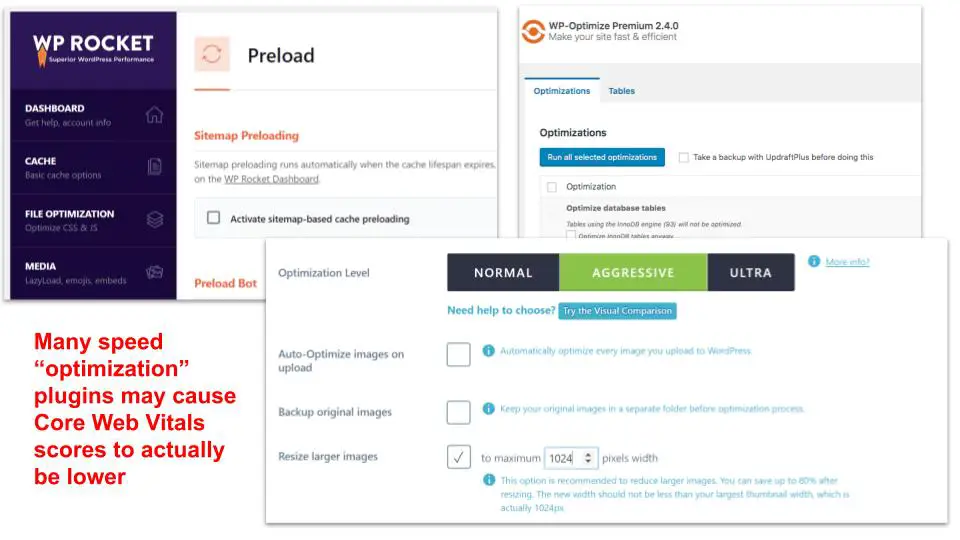
Any speed optimization tools or software could potentially impact FID, or our next metric LPC, if they require the execution of lots of javascript for execution. If the tools are delivered via plugin or by adding a snippet of code to the header of your website, it is worth evaluating how much these tools may be actually hurting your FID or LCP scores.
“If the tools are delivered via plugin or by adding a snippet of code to the header of your website, it is worth evaluating how much these tools may be actually hurting your FID or LCP scores.”
What is LCP (Largest Contentful Paint)?
LCP is measuring the “perceived” load speed to the visitor. It was — and arguably still is— calculated best by looking at DOM Interactive, but now Google is looking at this interaction a bit differently.

Most of what impacts this metric are above the fold images, video players, and other media that takes time to load prior to the portion of the page the user sees and interacts with is immediately available to them.
These need to load quickly and initially. So Google wants to ensure that everything a user is going to see when they land on the site (above the fold) is visible quickly and doesn’t jump around.
If you have media widgets or anything that’s “floating” on the page, that kind of could negatively impact this metric.
To optimize this, here are some things to consider:
- Floating newsletter or subscription sign-up bars
- Floating social media widgets
- Social media icons that load above the fold for article sharing
- Newsletter, login, or widgets that load in the visitor’s viewport of an article
- Videos that load above the fold (below we give options for this)
- Images above the fold (below we give options for this)
- Author boxes that are auto-injected with pictures on the page
How is LCP Different from FCP (First Contentful Paint)?
LCP = Takes into account things like media/video. When does the user see what the actual page is going to look like? Even if it’s going to load other things still in the background.
FCP = When is the first chance that the user actual sees your content? Doesn’t load menu, doesn’t see blank content but what’s the first instance of a user seeing your content.
On Google PageSpeed Insights, if you run a URL through it you will see an example of both the FID and LCP.
How To Acquire Better CLS
The best way to acquire better CLS is to lazy load images and ads. But when you do, you want to make sure the “pixels” for the location of those items are set.
For example: As the content loads in the GIF below, all the places for ads and images are already defined. If an image hasn’t loaded yet because we scroll really fast, it doesn’t move around. It would just be a white, blank space until you’re ultimately able to load the image.
Now what you don’t want is to have these images, ads, or videos, loading after the fact. So if you are lazy loading, make sure you have the space available, so your content doesn’t jump around.
There’s a full guide online with multiple CSS and Javascript codes to help you format your images and other content correctly so it provides a smooth load when the user scrolls.
Here is CSS code that you can wrap your images with enough padding to prevent jumping. You’ll also need to add the corresponding classes to containters around your images:
.wrapper {
position: relative;
height: 0;
/* Formula is: (height / width * 100%) */
padding-top: calc(360 / 360 * 100%);
}
.wrapper__img {
position: absolute;
top: 0;
left: 0;
max-width: 100%;
height: auto;
}
Additionally, if you use Ezoic’s Ad Tester, the ads that appear on your website are already padded correctly to where your site’s content won’t jump around for the user once they’re scrolling.
Remember: The better the user experience, the better your Core Web Vitals will be.
How To Improve LCP
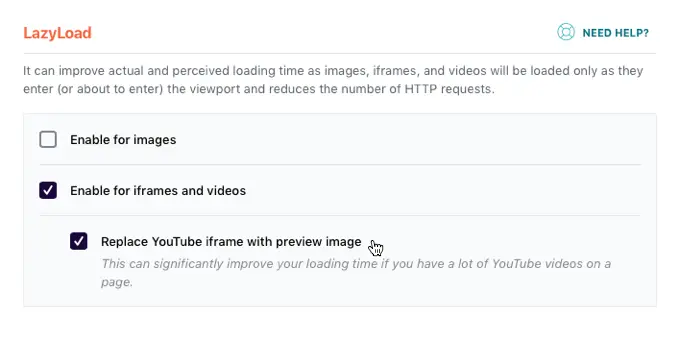
One helpful strategy to improve LCP outside of just lazy loading is to try to load thumbnail previews of videos instead of full videos on your page. There’s some info on how to do this here.
If you use WordPress, there are a number of tools and plugins that allow you to load YouTube iframes as a “preview” image and the user has to click to load, instead of the video loading upon page load. There is also some natively supported features for this in WordPress now too.
Making sure images are small file sizes and compressed is essential if you have article hero images loading on mobile. A good rule of thumb is to make sure you’re optimizing the images. Image sizes less than 100KB is ideal.
Simply using some kind of compression software or plugin/extension won’t do the job. We recommend re-sizing and optimizing them. When done correctly, most images can be gotten down to 40kb or less. Remember, mobile viewports are small, so images don’t need to be more than 650-800 pixels wide in most cases.
Additionally, having all the images on your website load in NextGen formats is another big benefit to website optimization; as these are very small file sizes by default. However, not all browsers can load these, so it’s not an excuse to not optimize images sizes.
How To Stop JavaScript From Increasing FID Time
The easiest way to stop JavaScript from increasing FID time is to use ensure that you add as little Javascript in the head of your website that delays anything from loading to the visitor. This means evaluating all the scripts added to the head of your website and any plugins currently being used if you’re a WordPress website.
As the more unnecessary javascript, you can remove from your website, the better. It’s worth looking at your website head code or at your WordPress plugins list to see if any could be turned off or deferred so that they’re only active on pages they are used.
How Important Are Core Web Vitals To Rankings?
Realistically, the most important thing to Google is the searcher gets a good search result. This is Google’s paramount ranking signal, “search satisfaction”. UX for Google is different than UX for a publisher. Google is ranking the top result the highest because it’s the best result for a specific search, that’s good UX by their definition. A small part of that may include the UX of the website the visitor lands on, and for that reason, Google is going to begin using Core Web Vitals as a way of understanding which sites might be doing this better than others.
Google will use this data when they are trying to evaluate two very similar results. If all other things are equal in terms of content, Google will likely use something like the Core Web Vitals to ake an ultimate determination.

You can think about it as a tiebreaker. Which is better: result #7 or 8? It is most likely in these types of situations where Google might apply the Core Web Vitals to shift around search results ranking.
Optimizing for Web Core Vitals Using Ezoic
If you’re an Ezoic user, there’s a good chance that you may be missing out on valuable advice on how to optimize your site for Web Core Vitals using Ezoic.
In this webinar, we cover everything from integration to specific settings in your account that can make a dramatic difference in your site speed when using Ezoic.
Will Improving Core Web Vitals Help SEO?
Google claims some of the ways to improve Core Web Vitals are:
- Reduce your page size to less than 500KB.
- Limit the number of page resources to 50.
- Consider using AMP.
Publishers interested in Google AMP have likely already explored it. But it’s interesting that Google is touting their own creation, AMP, as a solution to a new set of metrics they themselves created.
Here’s the truth: Don’t overly focus on these metrics. But do try to trim as much fat as possible from your website. If you use one plugin for CSS modification, another for image compression, and another for website speed, try to find one that does it all, like Ezoic’s Site Speed Accelerator.
The biggest thing is to focus on building a better website and delivering a better experience to the user. That will trump everything else you’re working on to improve these metrics.
Remember: Focus on your content. If you’re going to spend more time on these Core Web Vitals than your content, you’re going to be wasting your time and probably do more harm than good.
Do you have any questions on Google’s Core Web Vitals and how to optimize them? Let me know in the comments.

It looks a bit weird to me, basically, all my sites have this type of soft warning, funny thing, one is full AMP.
How to solve Google Web Vitals Errors
yes. My site goes from great to poor. What Should I do? I do not know how to improve it
I have good results on GTmetrix, my web nearly got 100 scores but in my GSC, showed a lot of my page got slow warning in Web Core Vitals section. How does it happen?
Web Core Vitals uses CrUX data which is a 30-day average — and not overly accurate — so any improvements in speed won’t actually be reflected until after 30 days of data has been collected (which actually might be delayed beyond that because who knows if Google is looking at the past 30 days, or a trailing 30 days)
Thanks for the article. Today, I checked my search console and I realised that it has 330 urls and 428 poor urls.
What can be done to ensure that I am totally free of this error?
My Core web vitals are all poor. I am not very technical and was wondering if anyone knew a good company that could do a project to fix this on my site?