Increasing CPMs Is Easy With The Right Data
I’ve talked a lot about why CPMs and RPMs can be misleading. In fact, optimizing for these metrics can actually lead to long-term revenue loss. However, there is a responsible way to approach increasing CPMs on your website that won’t ultimately harm your ad rates down the road or will negatively impact your EPMV (or per visit earnings/sessionRPM).
During a recent Pubtelligence presentation, Dr. Greg Starek (Data Scientist) discussed some data around what types of ads and ad placements could lead to higher CPMs in different geo-locations.
His insights around what types of variables ultimately led to increases in website CPMs were in many cases counterintuitive. Deciding ad types and placements isn’t as straightforward as it might seem.
Below, I’ll summarize some of Dr. Greg’s main points and highlight what can be done to begin increasing CPMs on your website.
Watch Dr. Greg Present This Material
Publishing is evolving, but are publishers?
Dr. Greg began his presentation by highlighting the evolution of publishing over the years.
While the mediums and methods that publishers have used to engage their audiences have changed, Dr. Greg argued that the traditional methods that publishers have used to adapt to these audiences really hasn’t.
While digital advertisers have evolved to ensure that different visitors on a web property are treated differently, publishers have generally failed at making this same adaptation.
Publishers — on average — still deliver all visitors the same experiences. This is leading to an asymmetry of opportunity between publishers and advertisers.
This imbalance of power means publishers are leaving money on the table while advertisers are able to more accurately extract value from the dollars they spend.
A/B testing means we’re data-driven, right?
The way Dr. Greg highlighted the difference in how advertisers and publishers use data is by highlighting how advertisers will use data to give all visitors a different experience (different ads) while publishers ultimately use data to give everyone the same thing.
He discussed why A/B testing has never been easier and is often publishers go-to method for making better decisions about what they should do with their web properties.
In this presentation, Dr. Greg focused on ad placements as a typical form of testing that publishers often apply this methodology to.
Using ad placements as a platform to discuss this topic, Dr. Greg launched into a very specific example of some data he collected that could easily lead a publisher to make an ill-informed decision that could ultimately decrease their CPMs and total ad earnings per visitor.
Should you display a sidebar ad or top of page ad?
The example Dr. Greg based his presentation on was the simple question of…
“…should we show an ad in the sidebar or at the top of the page?”
Easy enough, right?
Greg shared some data he had collected around geo-locations and ad engagement.
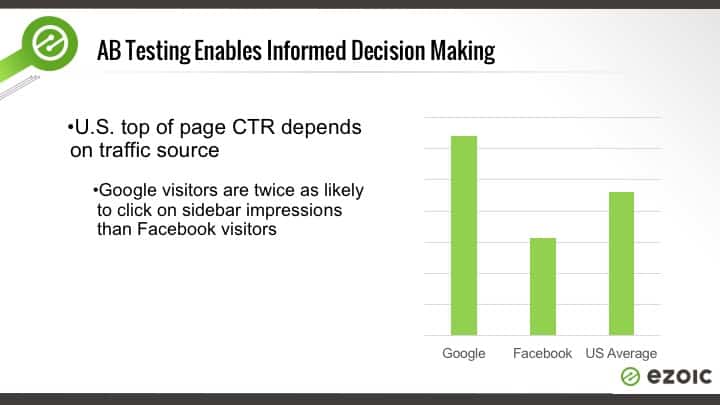
In this data, Dr. Greg showed that Ezoic had found a significant difference in top of page impressions among U.S. visitors.
This difference in visitor engagement could mean a higher CPM for these ad impressions.
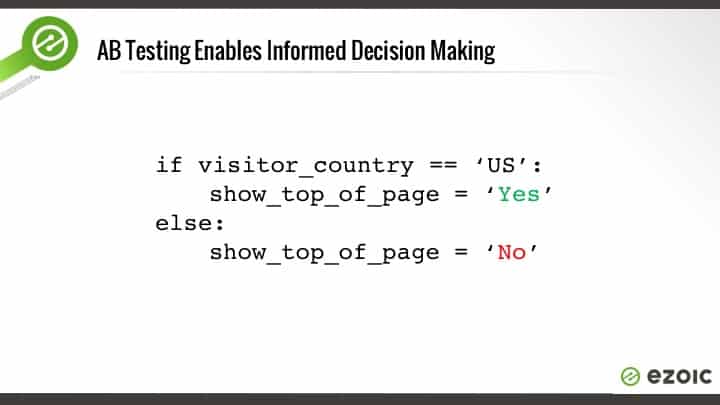
Dr. Greg told the crowd that if it was really this simple that they could simply write a rule that would allow everyone to capitalize on this data that we had collected at Ezoic.
He said it was statistically significant and would likely result in higher CPMs.
Dr. Greg then emphasized that traffic source played a role in the overall CTR of the ad as well.
This meant that traffic source would also likely contribute to the CPM that a publisher could expect to receive from different kinds of visitors.
He reminded us again how sophisticated advertisers are in determining ad placement bids vs. how publishers price them.
Dr. Greg then showed how you could amend the rules that you wrote to account for both geo-location and traffic source.
He said that you could essentially write rules like this for days if you had the right data and build some really sophisticated models designed at increasing CPMs or improving user experiences; whatever your end goal was.
Dr. Greg reminded the audience that both geo-location and traffic source are only a few signals (of hundreds) that could be looked at to look for statistical significance.
He then shared that this anomaly of higher CTR and engagement for top of page impressions in the U.S. — and by traffic source — was actually only represented on 60% of websites among the thousands that he studied.
This meant that the data above only applied to some of the websites that he studied… NOT ALL OF THEM!

This means that acting on this information could only actually potentially increase CPMs on 60% of sites; while doing absolutely nothing for the other 40%.
So, what?
Might as well roll the dice, right?
He shared that this data model essentially disappears over time as well. This means that after two years this anomaly goes away and any benefit from these rules would be gone.
His point was that broad decision-making often leads to lower CPMs over time and prevents publishers from seeing big ad earnings increases from simple, small changes. He inferred that traditional A/B testing is what can cause this to happen.
Ultimately, Greg said that this is the kind of data publishers use all the time and that it is both flawed and time-consuming.
[It’s fair to mention here that advertisers will always be one step ahead of publishers inside this model as well — i.e. A/B testing]
How to increase website CPMs without A/B testing
Dr. Greg did a great job of keeping everyone on their toes with his presentation of ad data.
While at first it seemed like Greg was delivering some great data for how publishers could increase their ad revenue, it turns out that following the data is a little more complex than reading the results of a few tests.
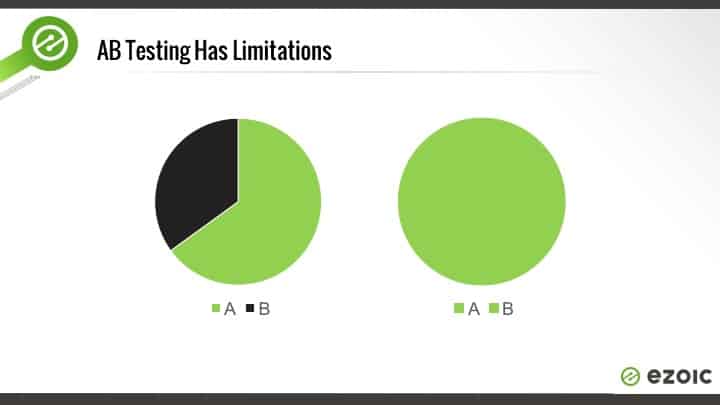
He reminded everyone that A/B testing almost always leads to A/A implementations; meaning that the results of the tests often deliver the same result to everyone within the test, even the ones that preferred the non-winning result.
In fact, testing across thousands and thousands of sites still doesn’t give us enough data in a bubble to make decisions that we can say will have a positive impact on ALL VISITORS, he claimed.
So, what’s better than A/B testing?
Dr. Greg then proposed that publishers begin to apply artificial intelligence to this solution instead. He explained how neurons worked and how typical human learning could be applied to these problems.
He claimed that advertisers were already doing a lot of this and that publishers would need to adapt themselves to take advantage of the digital medium that they were publishing on.
He shared a simplified example of how a machine might be able to apply intelligence to deduce the characteristics of a dog.
When exposed to enough dogs over time, the machine could write rules and weight them accordingly to determine what factors were most important when determining the attributes of a dog.
The machine would need to see a lot of dogs to understand all the different kinds of outliers.
Dr. Greg claimed that this was the type of model that would be most successful in determining ad placements and increasing CPMs along with overall website revenue.
He shared that this model of A.I. is similar to the way human learning works with neurons in the brain.
When exposed to enough data over time, humans begin to learn and differentiate the criteria necessary to make intelligent decisions.
This form of learning and problem solving is much more efficient than writing long algorithms that must account for hundreds of data points.
In this model, the machine learns the variables and weights them according to the goals.
Which ad location produces the highest CPM?
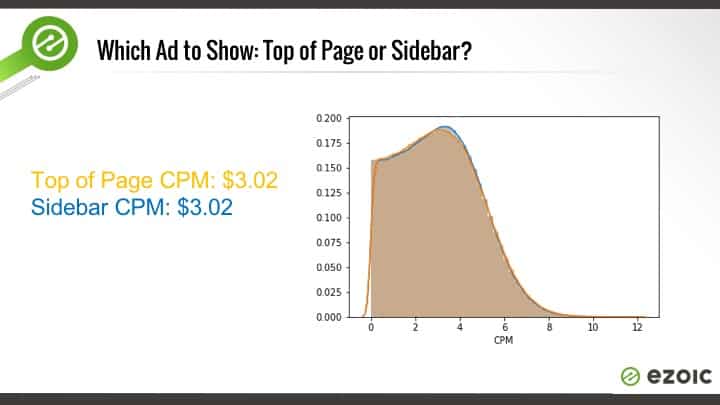
In this example, Greg highlighted how the CPMs were the exact same in the example above. He said that a CPM is a summary statistic and that he wants to look at how the data is distributed to see all of the data.
This, he claims, provides a much more granular look at why the CPM is $3.02 USD. To him, this is the data that can actually be used to produce a higher CPM, not just the arbitrary value of the CPM itself.
The above chart, Dr. Greg discovers that the distributions for these two positions are identical.
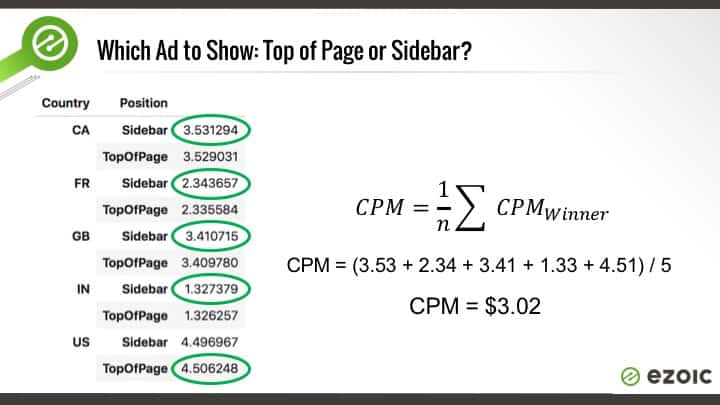
He said the best way to dig deeper is through segmentation. He chose to break things down using two dimensions inside Google Analytics.
This is where you can start to see the differences in how the CPMs are built.
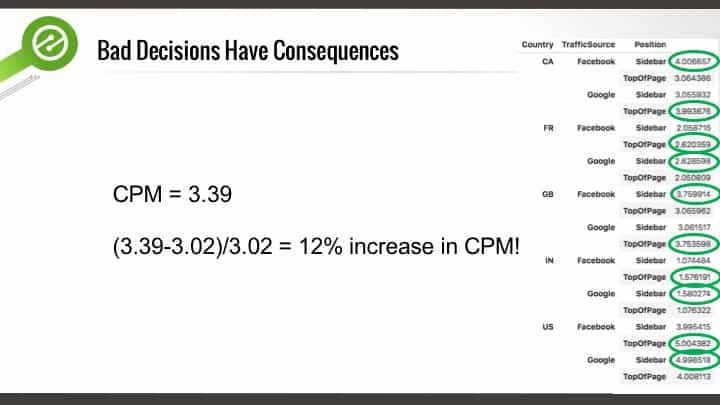
Geo-location and ad position present us with a nice matrix of how this decision could be potentially be made to maximize overall CPMs of both ad locations.
Using this data alone, he supplied a simple map of how publishers could map this data to maximize overall CPMs.
He claimed this could be done by using geo-location to adjust ad positions between the two locations.
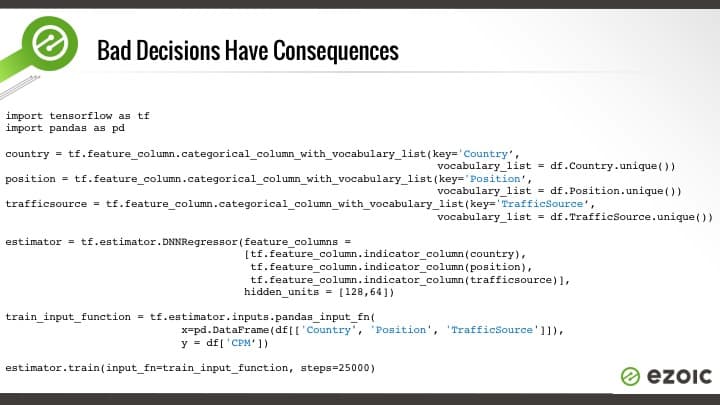
He then provided an example of how these variables could be outsourced to a tool like TensorFlow.
He claimed this method was far, far more accurate and could help publishers avoid writing long algorithms that relied on faulty premises.
In this example, he discussed how a machine could write the rule simply by entering in the variables. This way, the machine would write a rule for each visitor based on the variables the machine was optimizing for.
In Dr. Greg’s example, Tensorflow figured out how to segment the data automatically, in a scalable way. This found an extra 12% hidden in the data.
This emphasized his point about how it’s not the $3.02 CPM that is important. It is all the individual impressions that lead to that summary data.
Adapt to visitors and increase CPMs efficiently
Dr. Greg’s main point: Summary statistics are uninformative, and you’re leaving money on the table by not digging deeper into your data if you simply apply the exact same ad positions to every visitor. It doesn’t matter how many A/B tests you run. If you don’t change things per visitor, you’re losing money.
My thoughts on Dr. Greg’s presentation: He’s absolutely right. Advertisers have been adapting to different visitors in some form for over a decade. Publishers have been selecting ad placements the same way for over a century. Fixed locations mean that some visitors will be annoyed and have shorter sessions or will be less engaged with placements. This means lower CPMs and overall lower per visitor revenue.
Applying this in reality: Assuming you’re not a data scientist — and also assuming you don’t know how to write machine learning algorithms or use TensorFlow — you can try out Ezoic. It is a free machine learning platform for publishers that allows publishers to implement these types of methodologies on their sites for content, layouts, ads, and more. On average, sites increase their revenue by about 50%.


