Using Ezoic To Do Website Traffic Analysis
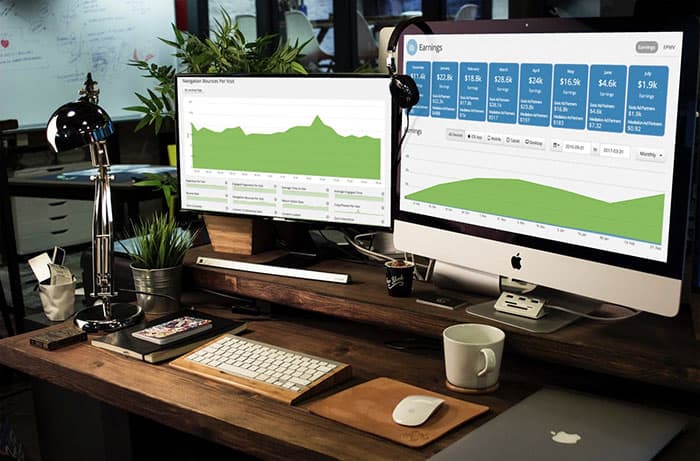
I’ve said it to hundreds of students and colleagues both; make sure you have Google Analytics running on your Web site and make sure you frequently check and analyze the data. There’s lots that’s actionable and it’s a sophisticated, professional tool. However, most publishers need to be doing a deeper website traffic analysis on their site.

Time for a true confession, though: I never look at my Google Analytics data. Fact is, since I’m not a Ph.D. statistician in the Googleplex it all just gives me a headache. Finding real actionable information in the Analytics UI is annoying to me.
Which is why it’s great that my AskDaveTaylor site uses Ezoic for layout and ad placement testing. By being at the DNS-level, Ezoic can also collect usage data and visitor analytics much better than Google Analytics can. After all, Ezoic can’t test multiple layout options if it can’t collect user data, right?
Why DNS-level data is better


The win is that the way Ezoic presents visitor information is a lot easier to understand than Google Analytics. And easy is something that site owners and publishers will actually check, monitor, and act upon. A clear win.
Looking at the full picture with Ezoic
One of the biggest factors you should be tracking — and trying to always improve — is page views per visit (but watch out for Fake UX in the process). It’s also a smart and easy way to understand how you’re doing in the mobile space too: are mobile visitors generally looking at more or fewer pages per visit than desktop users?
That’s easy to find in Ezoic’s Traffic dashboard area:

In this image, I’m looking at average pages per visit for just mobile users, for a period of approximately a month. Pretty even really, but the surprise was when I compared it to just desktop users: Desktop visitors have a much lower pages/visit count than mobile users, not at all what I’d expect.

I should also probably mention that Ezoic is a huge proponent of these new UX metrics that they call “engagement” metrics. They are basically all of the core UX metrics like bounce rate, session duration, and pageviews per visit on steroids. They look at those stats with a little more granularity; meaning they are supposed to help cut out instances where these stats may be getting artificially inflated. You can read more about them here.
But pages per visit is just one of the many categories of information you can view. Another variable that’s huge is Time On Site, which you can also easily view, whether it’s mobile, Apple devices only or combined:

Still, reading these graphs can be a bit tricky – kinda feels like Google Analytics – which is why it’s great that there’s a simple summary shown too:

This sort of information is terrific because it really demonstrates that a simple presentation of information is far more easily understood and far easier to act upon than complex data presentations. Sure, if you’re a statistician tables and obscure 3D graphs are cool, but give me a single number and let me see either it’s fine, it’s trending upward or, concerningly, it’s heading down and I need to address the problem.
Going even deeper with my website traffic analysis
There’s other information of great value to information publishers and any other Web site owner too, notable data on your most popular pages, landing pages, and overall traffic trends, all presented in one place. What I most appreciate about the Ezoic backend, however, is that the information collected is presented in an easy to understand manner.
Now, the burden’s on you: are you collecting analytic data? If you’re working with Ezoic are you checking the Ezoic data to ensure everything’s good and trending in the right direction as we head into the 2017 holiday season?
If you’re not using Ezoic, you can get onto the platform for free and leverage their analytics while diverting only a tiny a bit of traffic through their system if you want to start diving deeper into your own data.

