
Website Analytics Reports for Boosting and Monitoring Ad Earnings

Get helpful updates in your inbox
What Website Analytics Reports Are Best for Boosting and Monitoring Ad Earnings?
Website analytics reports are essential for growing and boosting publisher ad earnings. Knowing what reports and metrics can lead you in the right direction is crucial. Simply understanding where revenue is coming from, what is likely to generate higher ad earnings, and what could be easily fixed to improve traffic or ad earnings growth can be transformational to your online business.
For publishers using Ezoic, most are familiar with Big Data Analytics — analytics pre-built just for publishers (free to sign-up and use at Ezoic.com). One of the big benefits of Big Data Analytics is the DNS-level data. It is not simply a script tag that’s placed on your page, but the information we receive on the DNS level gives you a more granular look at metrics like visitor behavior, session value, SEO, article length, and how each of these things affects your earnings.
In this blog, I’m going to walk you through the benefits of DNS website analytics data and some Big Data Analytics most helpful revenue reports. I’ll show you how to use this website analytics data to make your website grow faster.
Why is looking at EPMV of landing pages an important practice?
If you’re interested in understanding what content is driving the most revenue on your website, the first stop within Big Data Analytics you should go to is the “landing pages” drop-down within the “content” tab. This opens metrics that are ordered by landing pages on your site.
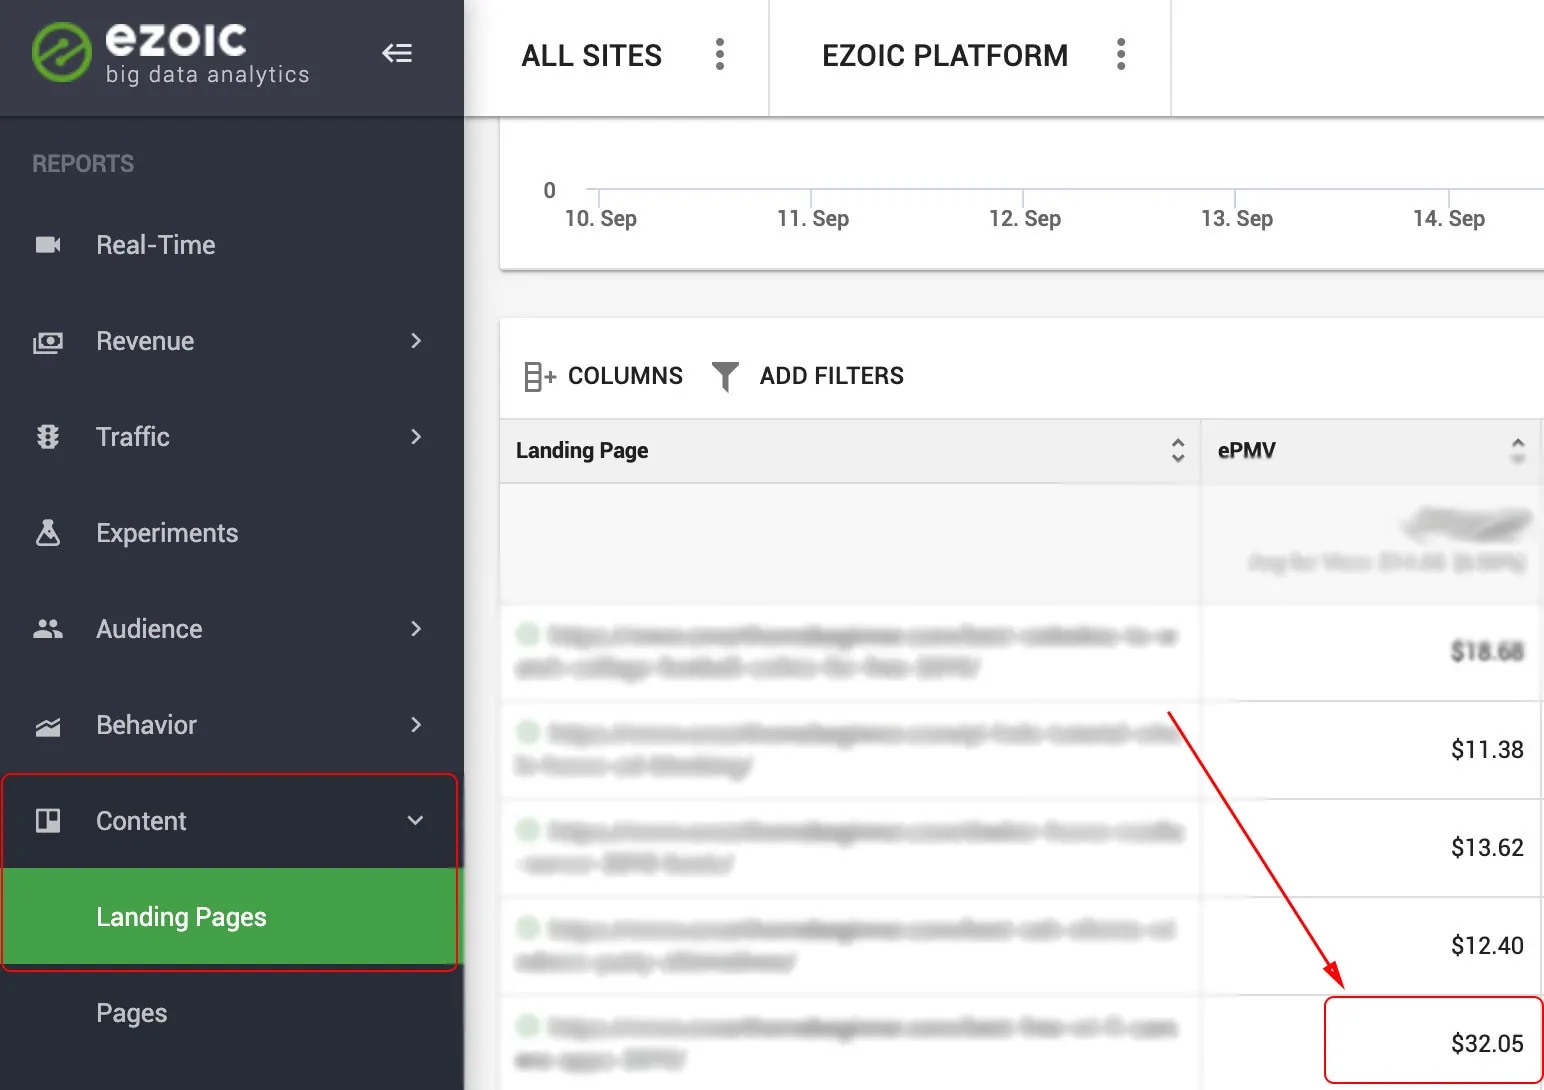
Normally, EPMV is the column farthest to the right on the landing pages data. Click and drag the EPMV column to where it’s side-by-side with the ‘landing page’ column which shows the URL of the pages.
EXAMPLE: This niche publisher’s site is all about vacuums. While the site’s overall EPMV is hovering around $14.00, the landing page that’s highlighted above has a whopping EPMV of $32.05. This is double the overall EPMV. Upon second glance, the landing page is about the new Dyson vacuum. As a publisher, you can ask yourself, “Is there any additional content I can write around this topic?”
While this isn’t always the case, it’s a good starting point for utilizing big data analytics. In the long run, it will help you evolve your content, improve users’ experience, and improve revenues.
Helpful Tip #1: Use the filter function to show only landing pages with Visits < (greater than) 1,000 to get a more accurate view of averages and pages that might be the most relevant
Frameworks reporting is important if you use AMP or PWAs
Frameworks within Big Data Analytics is a report housed within the “Technology” tab. It’s a beneficial metric to check for publishers, especially for those who have AMP pages on their sites.
Oftentimes publishers have AMP pages, but they have no clue how well they perform. It’s a metric that’s nearly impossible to track within Google Analytics. You might wonder: “How many visits am I getting, and are those visits worth the traffic going to AMP pages?”
Typically what we’ve found from the data of thousands of different sites is that on AMP pages, EPMV is lower than with other frameworks. However, you can check this for yourself by comparing AMP pages to regular mobile pages in Big Data Analytics (this is almost impossible to do properly in Google Analytics)
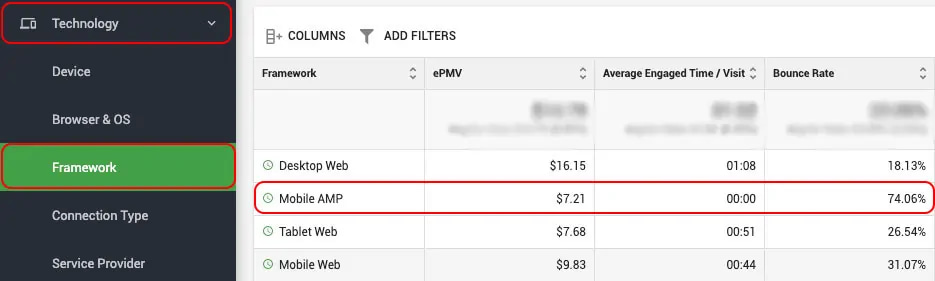
For this site, EPMV for mobile AMP pages is the lowest out of desktop, tablet, and mobile traffic. It also has the highest bounce rate at 74.06%. NOTE: Engaged time is 00:00 for AMP because it is impossible for analytics to tell time on site because AMP is a cached page on Google’s own domain (even Google Analytics cannot provide reliable info on this metric).
Does this mean you should avoid using AMP for your site altogether? That depends on the goals of your site and how AMP is ultimately performing on your website and if it has added any real improvements to UX or website traffic (this has not been something we have commonly observed).
Using Categories to highlight high-earning content?
EPMV by Landing Pages is a great place to discover any potential discrepancies in your earnings, hints of what future content to create, and what old content to augment.
Categories within Big Data Analytics, however, can take your content strategy to the next level. This provides a deeper look at your content and how it’s performing monetarily, along with a whole suite of other metrics.
We have an in-depth article on how to using data from categories to grow your website, but today will take you through how to utilize the category data to inform your content strategy.
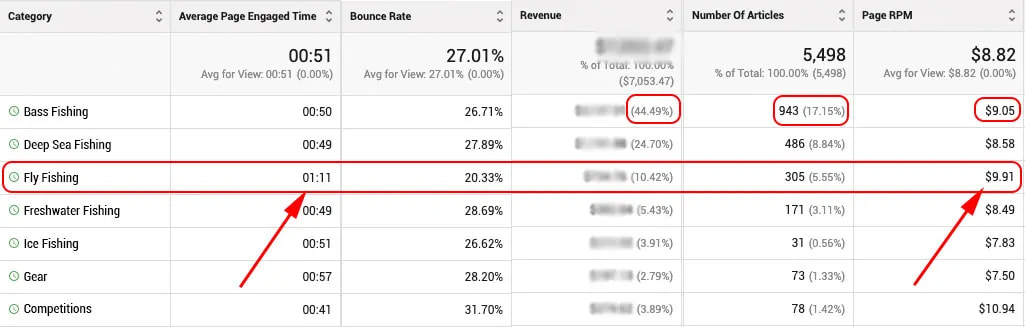
Let’s take this example of a fishing blog that has categories set up on their site. Here are their earnings by category on Big Data Analytics.
You can see that “Bass Fishing” accounts for 44.49% of the total site revenue, and also accounts for the highest percentage of articles created as well (17.15%).
But, looking at the EPMV by article category you see that “Fly Fishing” has the highest EPMV by far of all the categories. What’s more, is that the “Average Page Engaged Time” is 1 minute and 11 seconds, a good 20 seconds longer than the majority of the other categories.
What we know for certain from this data is that:
- Visitors spend on average 20 seconds longer on Fly Fishing articles than any other category
- The earnings per thousand visitors are at least 85 cents higher than any other article category.
If you were this publisher trying to grow your website and increase ad revenues, this type of data is paramount to your future content strategy. You now know that while fly fishing only accounts for 10.42% of the total articles on the site, that percentage can increase in time as new content about Fly Fishing is created.
With Fly Fishing’s engagement time and EPMV significantly higher than all the other categories on the site, we can presume that if a lot of new content is created within that category, site revenue will increase.
Helpful Tip #2: If your category data is empty, you can easily add category data to your site using basic WordPress functions or using meta category tags in HTML. Then, after a few weeks you should have enough data to see these reports in a helpful way.
Why you should look at Traffic Source data a little closer…
Traffic Source is a tab within Big Data Analytics that has reporting options like source/medium, referrals, and recommended pages housed within the main tab. Traffic Source can help you identify which sources have the highest EPMV, engagement time, visits, and more.
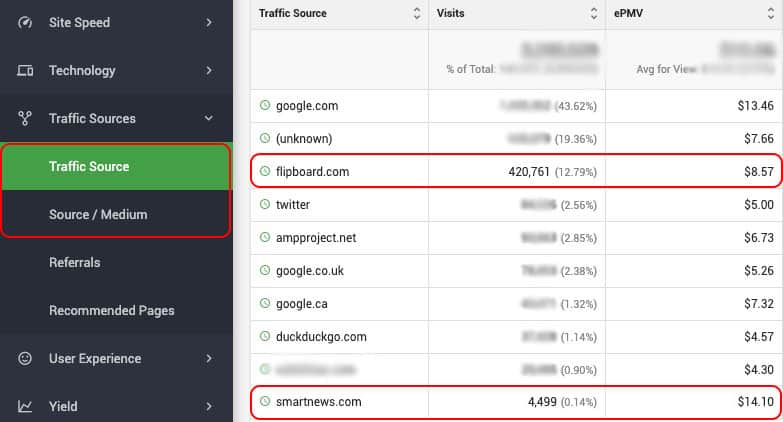
EXAMPLE: This publisher has a fairly large chunk of traffic coming from flipboard.com, a news app. They also have a very small percentage of traffic coming from another news app, smartnews.com, but the EPMV is almost double the EPMV of Flipboard’s traffic. This could help the publisher decide which platform is the best use of their time and energy when sharing and promoting content.
When it comes time to make decisions around where to invest your energy as a publisher, you might have questions like: are my AMP pages profitable? Which social channels are the most valuable drivers of traffic on my site? Which mediums performed better this month compared to last month? Traffic sources can help you answer those questions.
Why is traffic source important for monitoring overall revenue?
It’s common knowledge that ad rates rise and fall with seasonality. Oftentimes, publishers overreact to these market shifts. This causes them to create variables that negatively affect revenues and are hard to account for in the grand scheme of things. So, what does Traffic Source have to do with this?
If you regularly monitor Traffic Source, you can see how sources are performing and compare them to previous weeks or months. This is especially helpful if you’ve added or removed a traffic source from your site.
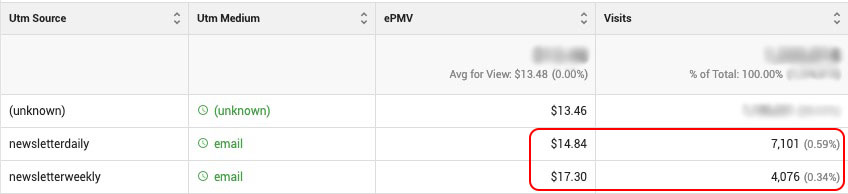
Example: This publisher recently added a daily newsletter in addition to their weekly newsletter to test its effectiveness in increasing website visits. After checking their Traffic Mediums, their weekly newsletter has a higher EPMV than their daily newsletter. But, the daily newsletter has a higher percentage of visits in comparison to the weekly newsletter. This may help the publisher decide to keep the daily newsletter as well.
Using the Audience tab to plan content that will perform better
The audience tab shows demographics, language, and location. It is a good measure of the value of your different audiences, and can in some instances aid in content planning.
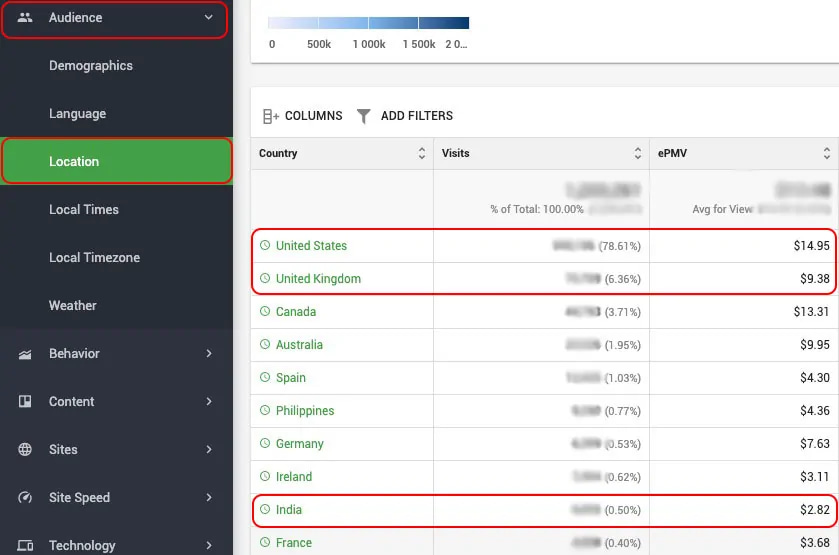
Example: If you’re an Indonesian website and all your traffic is Indonesian, but you’re seeing an increasing percentage of non-Indonesian traffic interact with the few English articles you have no your site, maybe write more English content. It’s common to see that web visitors from the US, UK, and Canada having the highest value for advertisers and subsequently, your revenues.
Does this mean you need to go out and immediately start writing English content if your audience isn’t primarily from an English-speaking country?
No, but what’s important is you do what’s best for your visitors. The audience tool simply provides an additional layer of insight into your content to better inform your decisions as a publisher.
How do I address sudden drops in my ad earnings?
Publishers will often see a drop in either traffic or revenue. Oftentimes, it’s both that are affected, and to a publisher, an unexpected change can send them spiraling down the path of assigning blame rather than investigating the true root cause of the issue.
One of the benefits of being at Ezoic is that we’ve seen hundreds upon hundreds of these types of ‘traffic drops’ over the years. What they all have in common is the fact they all tend to be unique.
The trick to solving these problems is starting with the data and working backward. We have a guide to help you diagnose sudden drops in traffic and earnings. This in-depth guide covers all the bases of drops in revenue, drops in traffic, or both. It’s the best place to assess what happened before jumping to an assumption.
Other causes of sudden drops in traffic and revenue
Outside of Google Core updates and changes to organic search traffic, many times sudden drops in traffic and revenue can be attributed to more innocuous factors such as a publisher making changes to their sites.
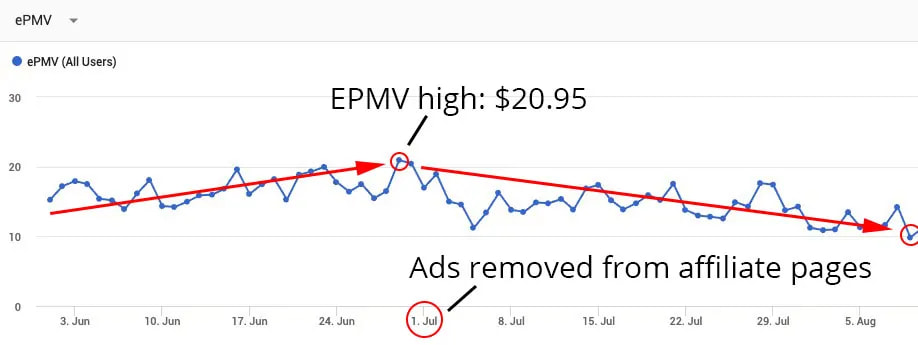
Example: This publisher was so successful with their Amazon Affiliate revenues that they decided to remove ads from the affiliate pages. While their affiliate revenues increased significantly, their EPMV from ads decreased to almost half of its high point. This may be worth it in the long run if affiliate earnings make-up for the drop, but it is important to understand how certain articles may be contributing to overall averages.
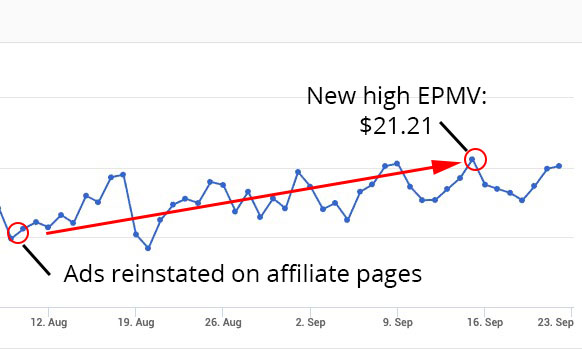
Once the publisher selectively added the ads back on the affiliate pages, the EPMV continued to increase to a new high of $21.21. Now, the publisher had found a happy medium between the affiliate and ad earnings by using data from both Ezoic and their Amazon Affiliates account to ensure they were maximizing both.
Other best practices for website analytics and ad earnings
These starting points for exploring Ezoic’s Big Data Analytics are a great foundation for building your analytical mind as a publisher. The deeper the understanding you have of your site data, the more holistic a picture you paint of its performance.
That being said, there are additional functionalities within Big Data Analytics that are helpful in seeing the big picture within your site data.
- Pages without Revenue: You might have a unique post or page on your site that doesn’t have placeholders (if you’re using Ezoic), pages with Google ad policy violations, or another error that is preventing revenue form generating. This report can help with that. It is housed within the “Content” tab.
- New vs. Return Visitors: this report can be pulled to get a deeper look at your site’s growth and metrics with a focus on new vs. return visitors. This is an even more specialized report than the “compare” feature available all individual reports in Big Data. This report is in the “behavior” tab.
- Connection Effective Type: Since many publishers are concerned with site speed’s effect on their organic search traffic, this report can help you see engagement time and bounce rate in relation to a user’s connection type (4g, 3g, 2g, etc.) We also have an article on how to improve page speed for Google in actionable ways. (see the demo below)
To sum it up: the most effective digital publishers are the ones who answer their questions with actual data.
With Big Data Analytics, you can take on the mentality of a digital detective. Always lean on concrete answers, not baseless assumptions. Additionally, the reporting tools within Big Data available to you as a publisher are more extensive than Google Analytics and can help you understand your site’s performance and growth better.
Questions? I’ll respond to any questions or comments below.
Allen is a published author and accomplished digital marketer. The author of two separate novels, Allen is a developing marketer with a deep understanding of the online publishing landscape. Allen currently serves as Ezoic's head of content and works directly with publishers and industry partners to bring emerging news and stories to Ezoic publishers.
Featured Content
Checkout this popular and trending content

Ranking In Universal Search Results: Video Is The Secret
See how Flickify can become the ultimate SEO hack for sites missing out on rankings because of a lack of video.
Announcement

Ezoic Edge: The Fastest Way To Load Pages. Period.
Ezoic announces an industry-first edge content delivery network for websites and creators; bringing the fastest pages on the web to Ezoic publishers.
Launch

Ezoic Unveils New Enterprise Program: Empowering Creators to Scale and Succeed
Ezoic recently announced a higher level designed for publishers that have reached that ultimate stage of growth. See what it means for Ezoic users.
Announcement
